
SaaS revenue dashboard
The screen a subscription business opens every morning. MRR and its movement, revenue against a weekly target, plan mix, top customers and the charges underneath, with an AI review and a failed-payment chase run from the page.
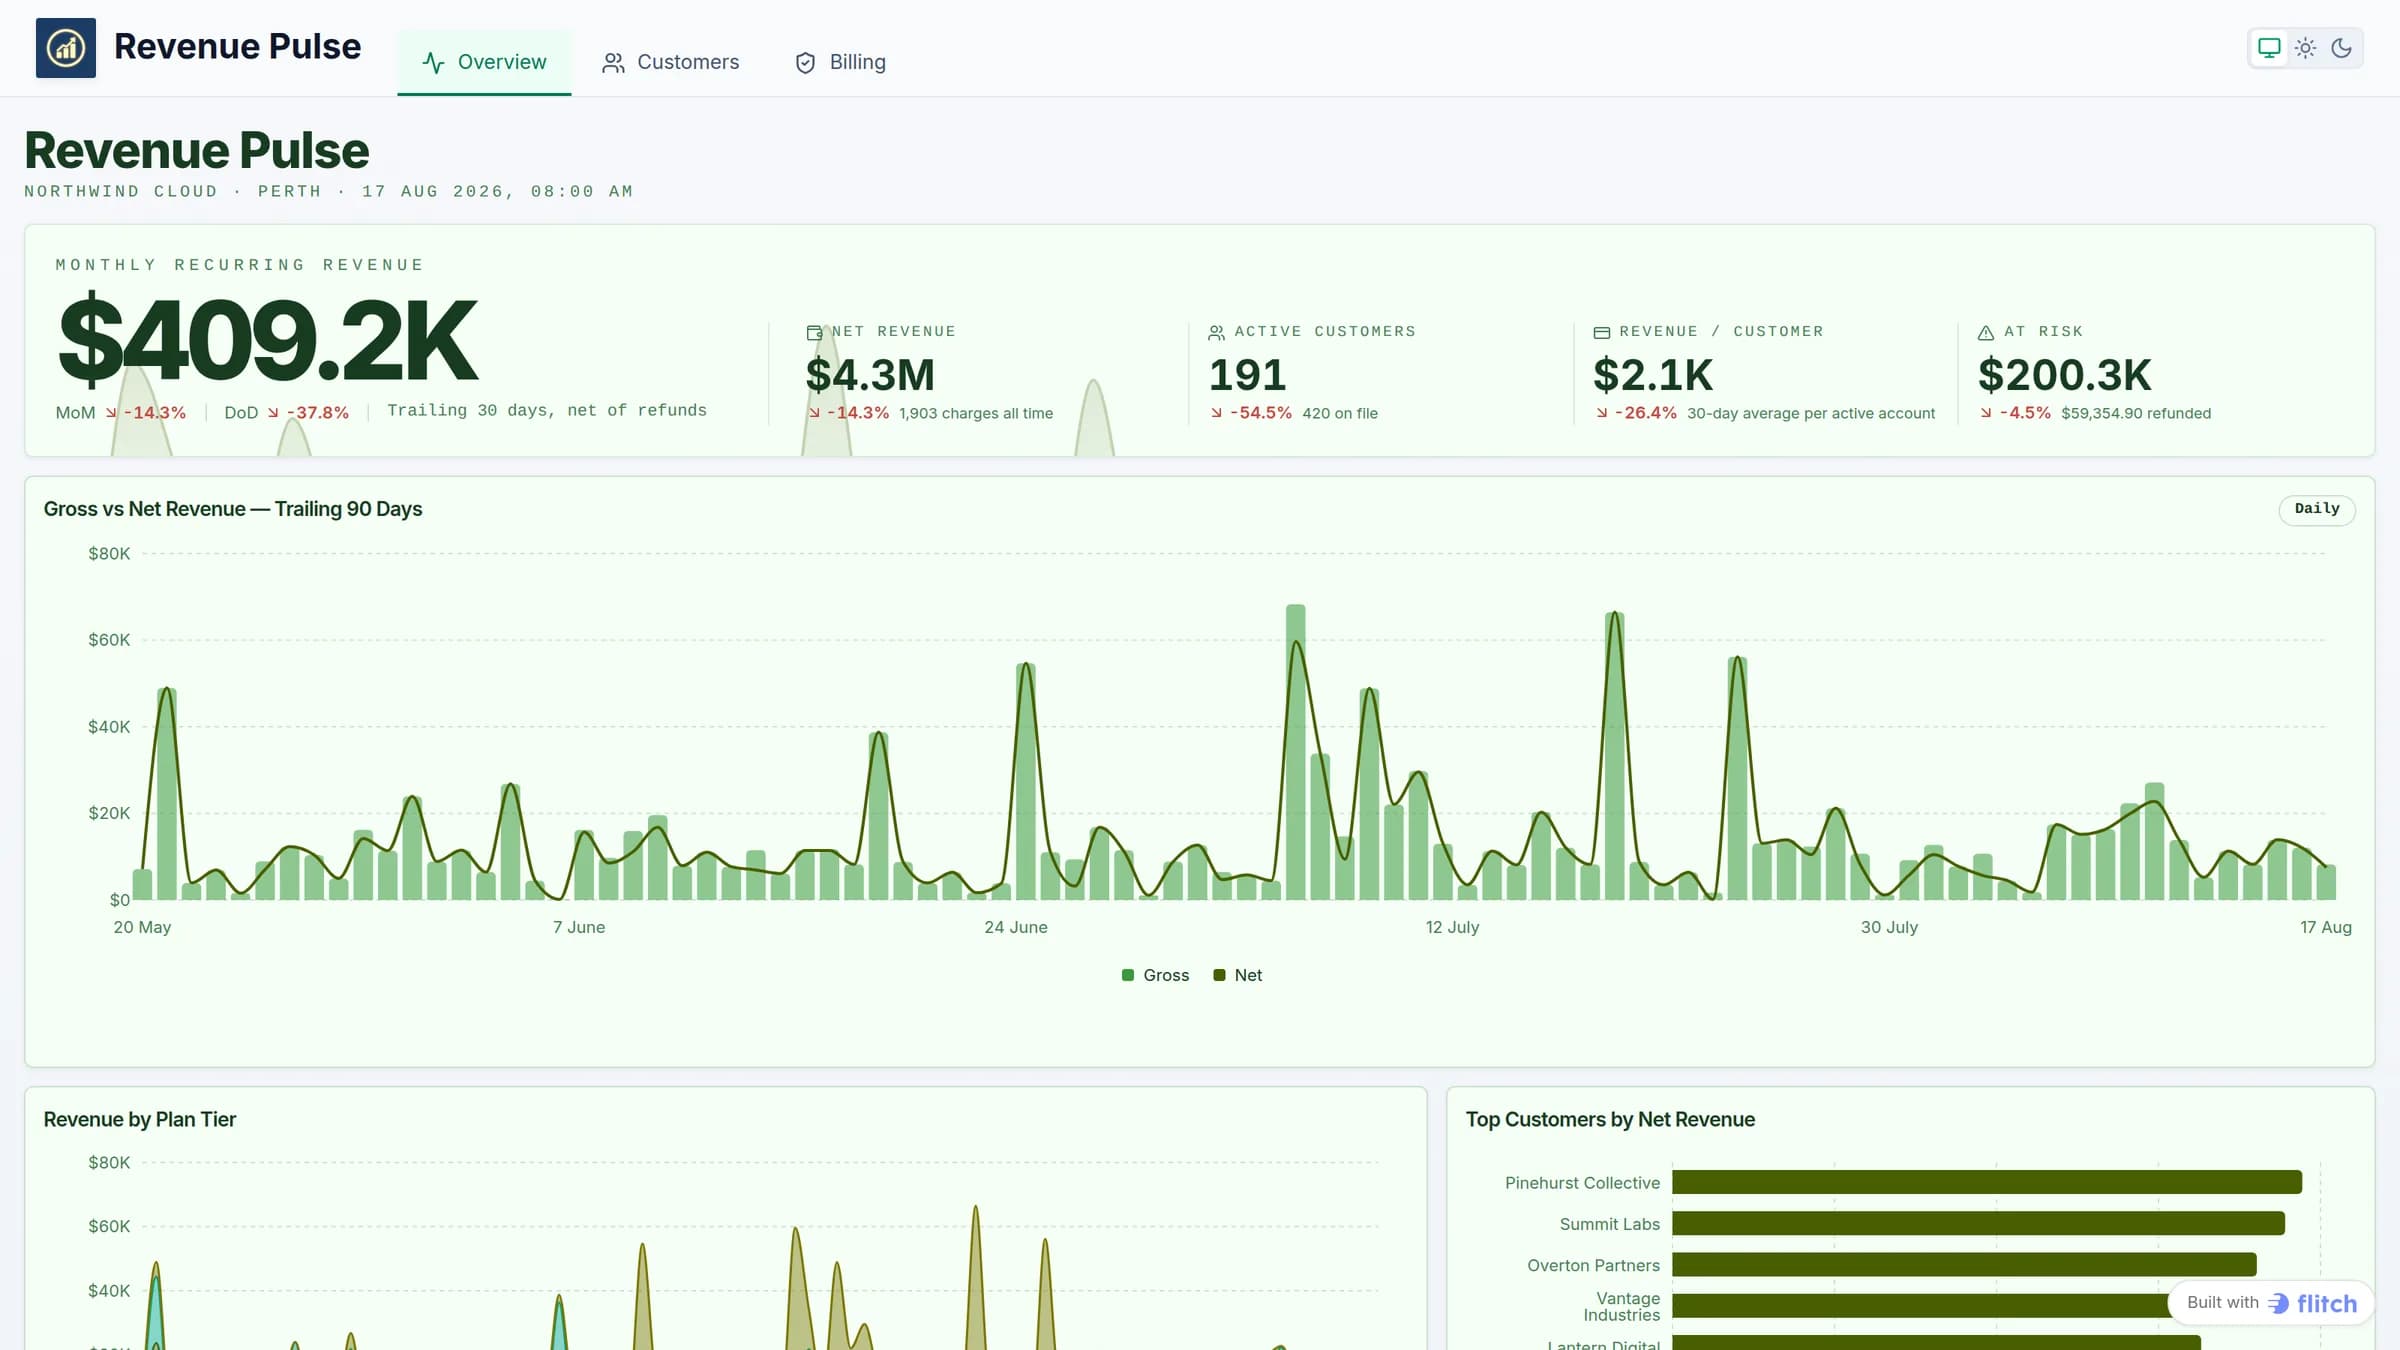
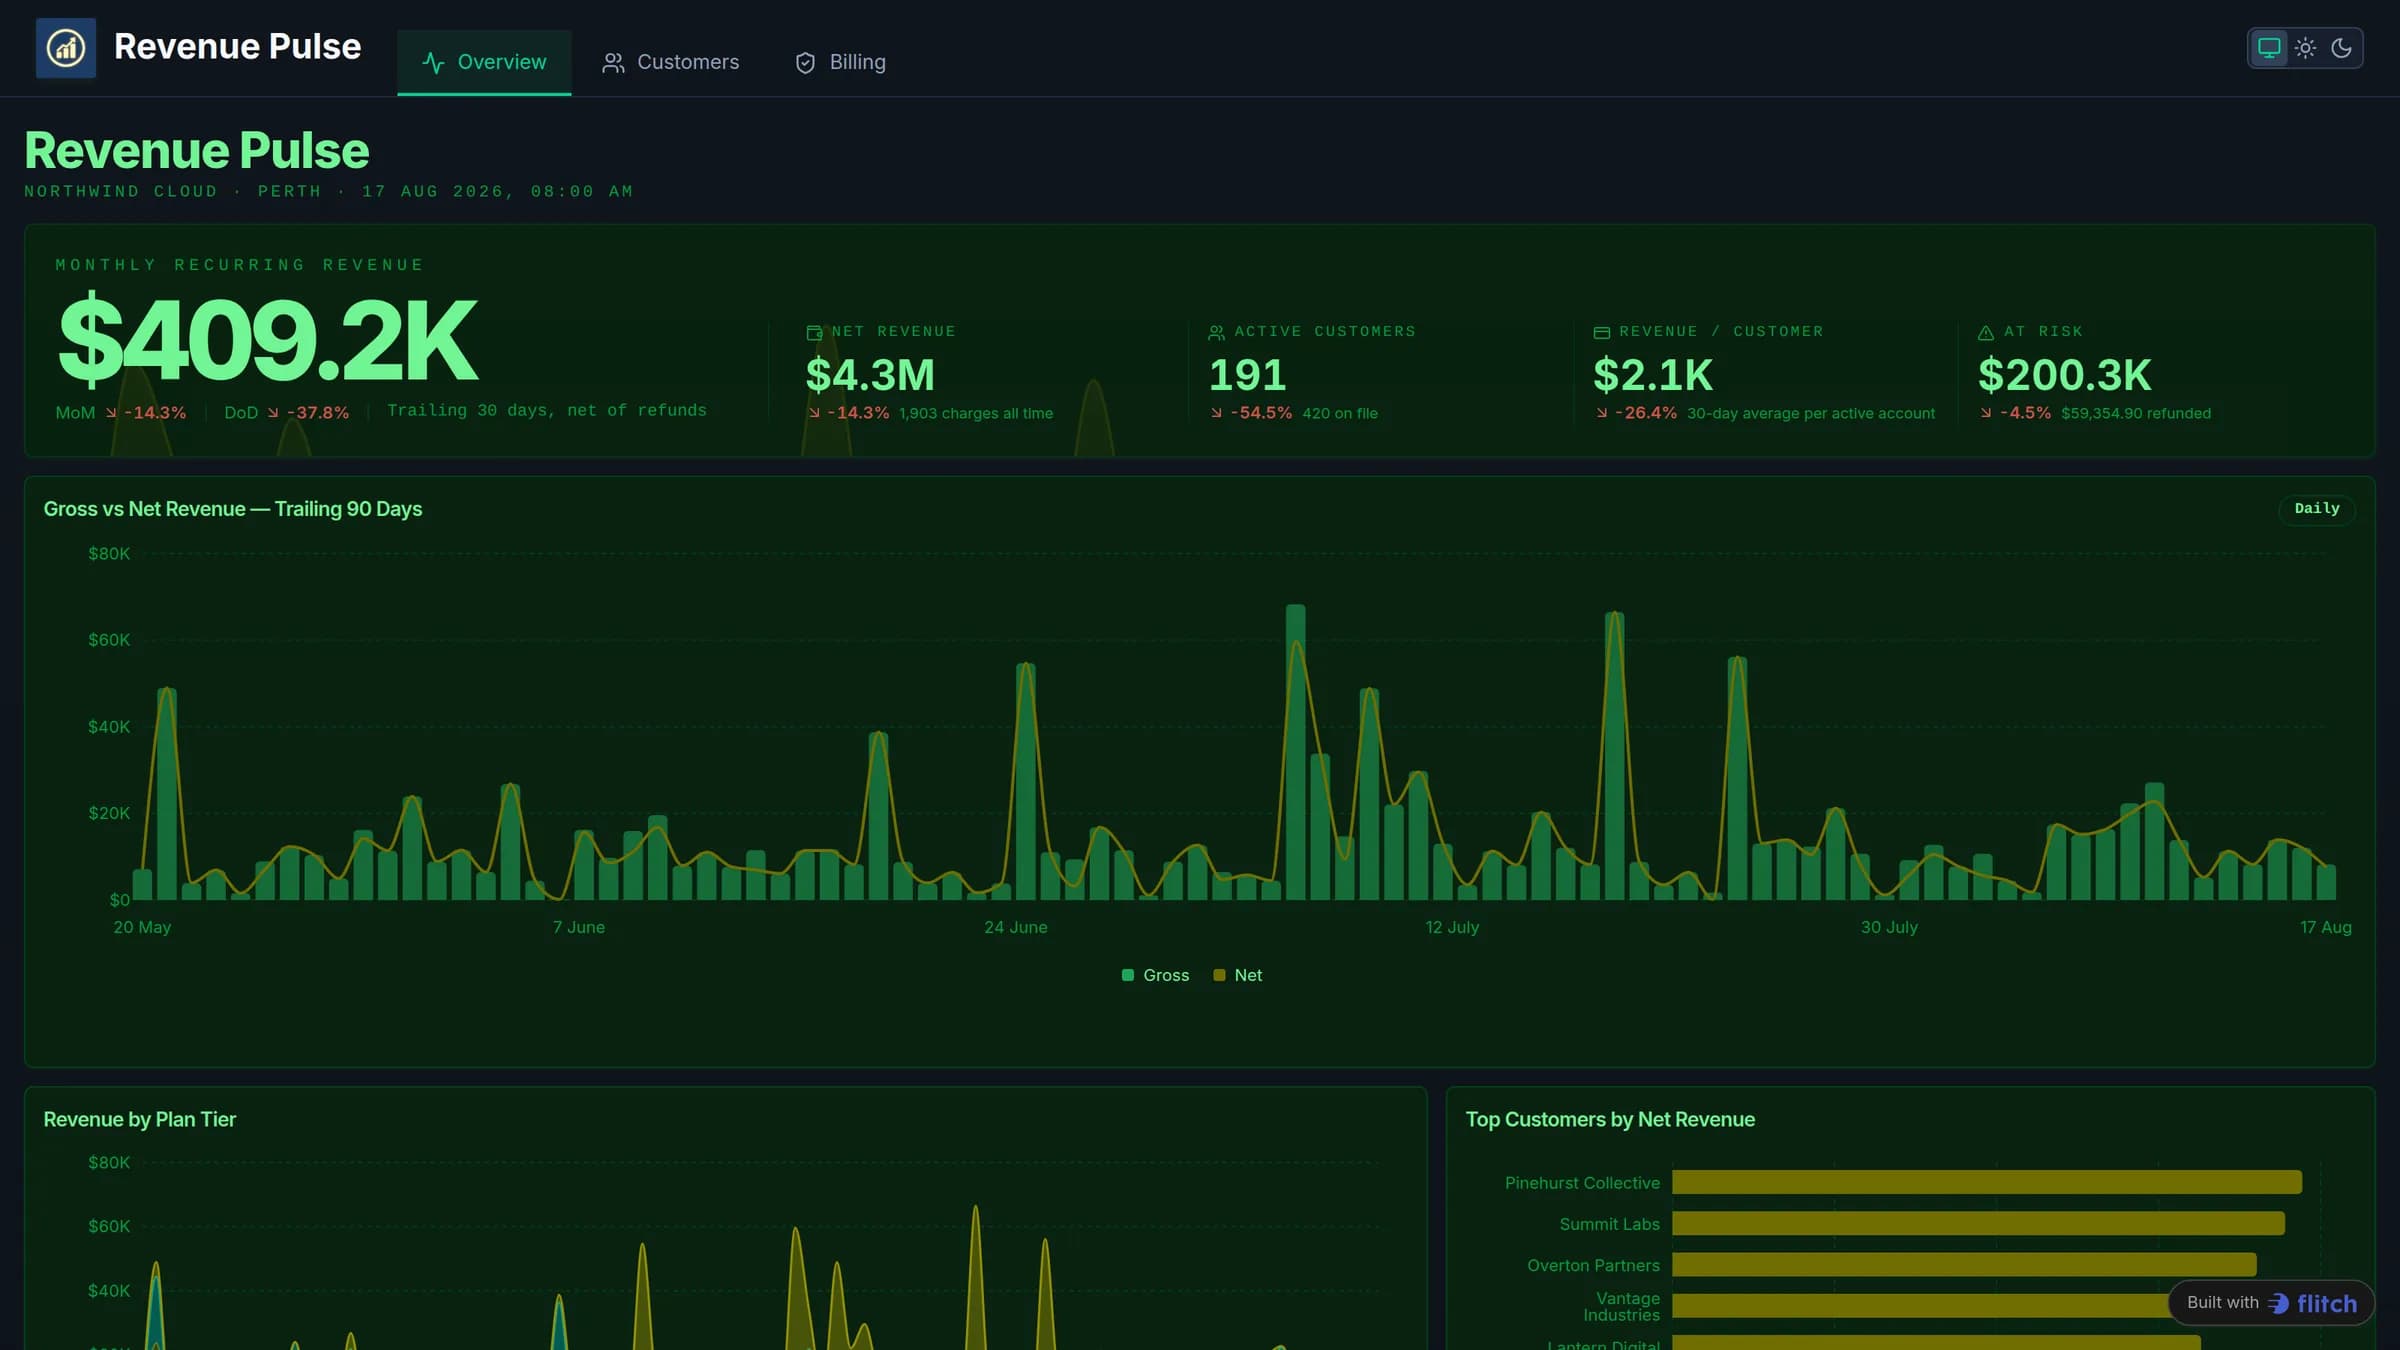
A working revenue app built in Flitch on Stripe billing data. One page: it leads with the numbers, charts net revenue against a target the reader sets, and puts the individual charges underneath, so any figure can be traced to the rows it came from. Buttons on the page review the numbers with AI and chase failed payments.
What the dashboard does
- Monthly recurring revenue with its month-on-month and day-on-day movement, as the first thing on the page
- Net revenue, active customers, revenue per customer and revenue at risk, each against its own trend
- Net revenue against a weekly target over the trailing 90 days, with the last 30 days shown as actual, plan and the difference
- A target the reader updates in place: a weekly figure and the growth each week
- Review with AI, which reads the page's figures and points at the card behind each finding
- Chase failed payments, which drafts a reminder to each customer with a failed charge and marks those rows as being chased
- Farmgate sales entered in a grid on the page, counted in every total
- Revenue by plan tier over the same window, filterable to a single tier from the header
- The customers carrying the most revenue, ranked
- Recent charges in a sortable table, each row markable for follow-up, with entries you can add by hand
What data sits behind it
How it was built
Nobody laid this out by hand. It came from one prompt, against the datasets above, and was refined from there. This is the prompt, unedited.
Build "Revenue", the dashboard a subscription business opens every morning. This one is a dashboard and it should be an excellent one. Lead with the numbers, chart generously, and make the state of the business readable in about ten seconds from across a desk.
SaaS revenue dashboard FAQ
Is this real revenue data?
No. It runs on a synthetic subscription business: 420 customers, and around 1,900 invoices and the charges against them across 22 months, generated so that the growth, the churn and the failed payments all agree with each other. Replace the datasets with your own when you copy it.
Can I point it at my own Stripe account?
That is what it is built for. The datasets carry Stripe’s own field names and formats, including amounts in minor units and epoch timestamps, so the dashboard reads a real Stripe connection the same way it reads the sample.
Why does the charge table let me type entries in?
Because revenue a payment processor never sees is still revenue. A dashboard in Flitch can hold an input table, so the row you would otherwise keep in a spreadsheet lives beside the figures it belongs to, and every total on the page moves with it.
Do the Review with AI and Chase failed payments buttons run real workflows?
Not in the template. Each plays a sample run on the page, so nothing is emailed and no model is called. In your copy, ask Flitch to connect either button to a workflow of your own, and it runs that instead.
What do I get when I copy it?
Your own copy in your own space, with its own copy of the data. Nothing you do to your copy touches the original.
Start from this one
You get your own copy, with its own data, in your own space. Change anything you like.
Use this template