
Mining fleet dashboard
A live operations console for an open-pit mine. Every truck, digger and drill on a satellite map of the site, with a 24-hour replay, delay logging, and shift production against target.
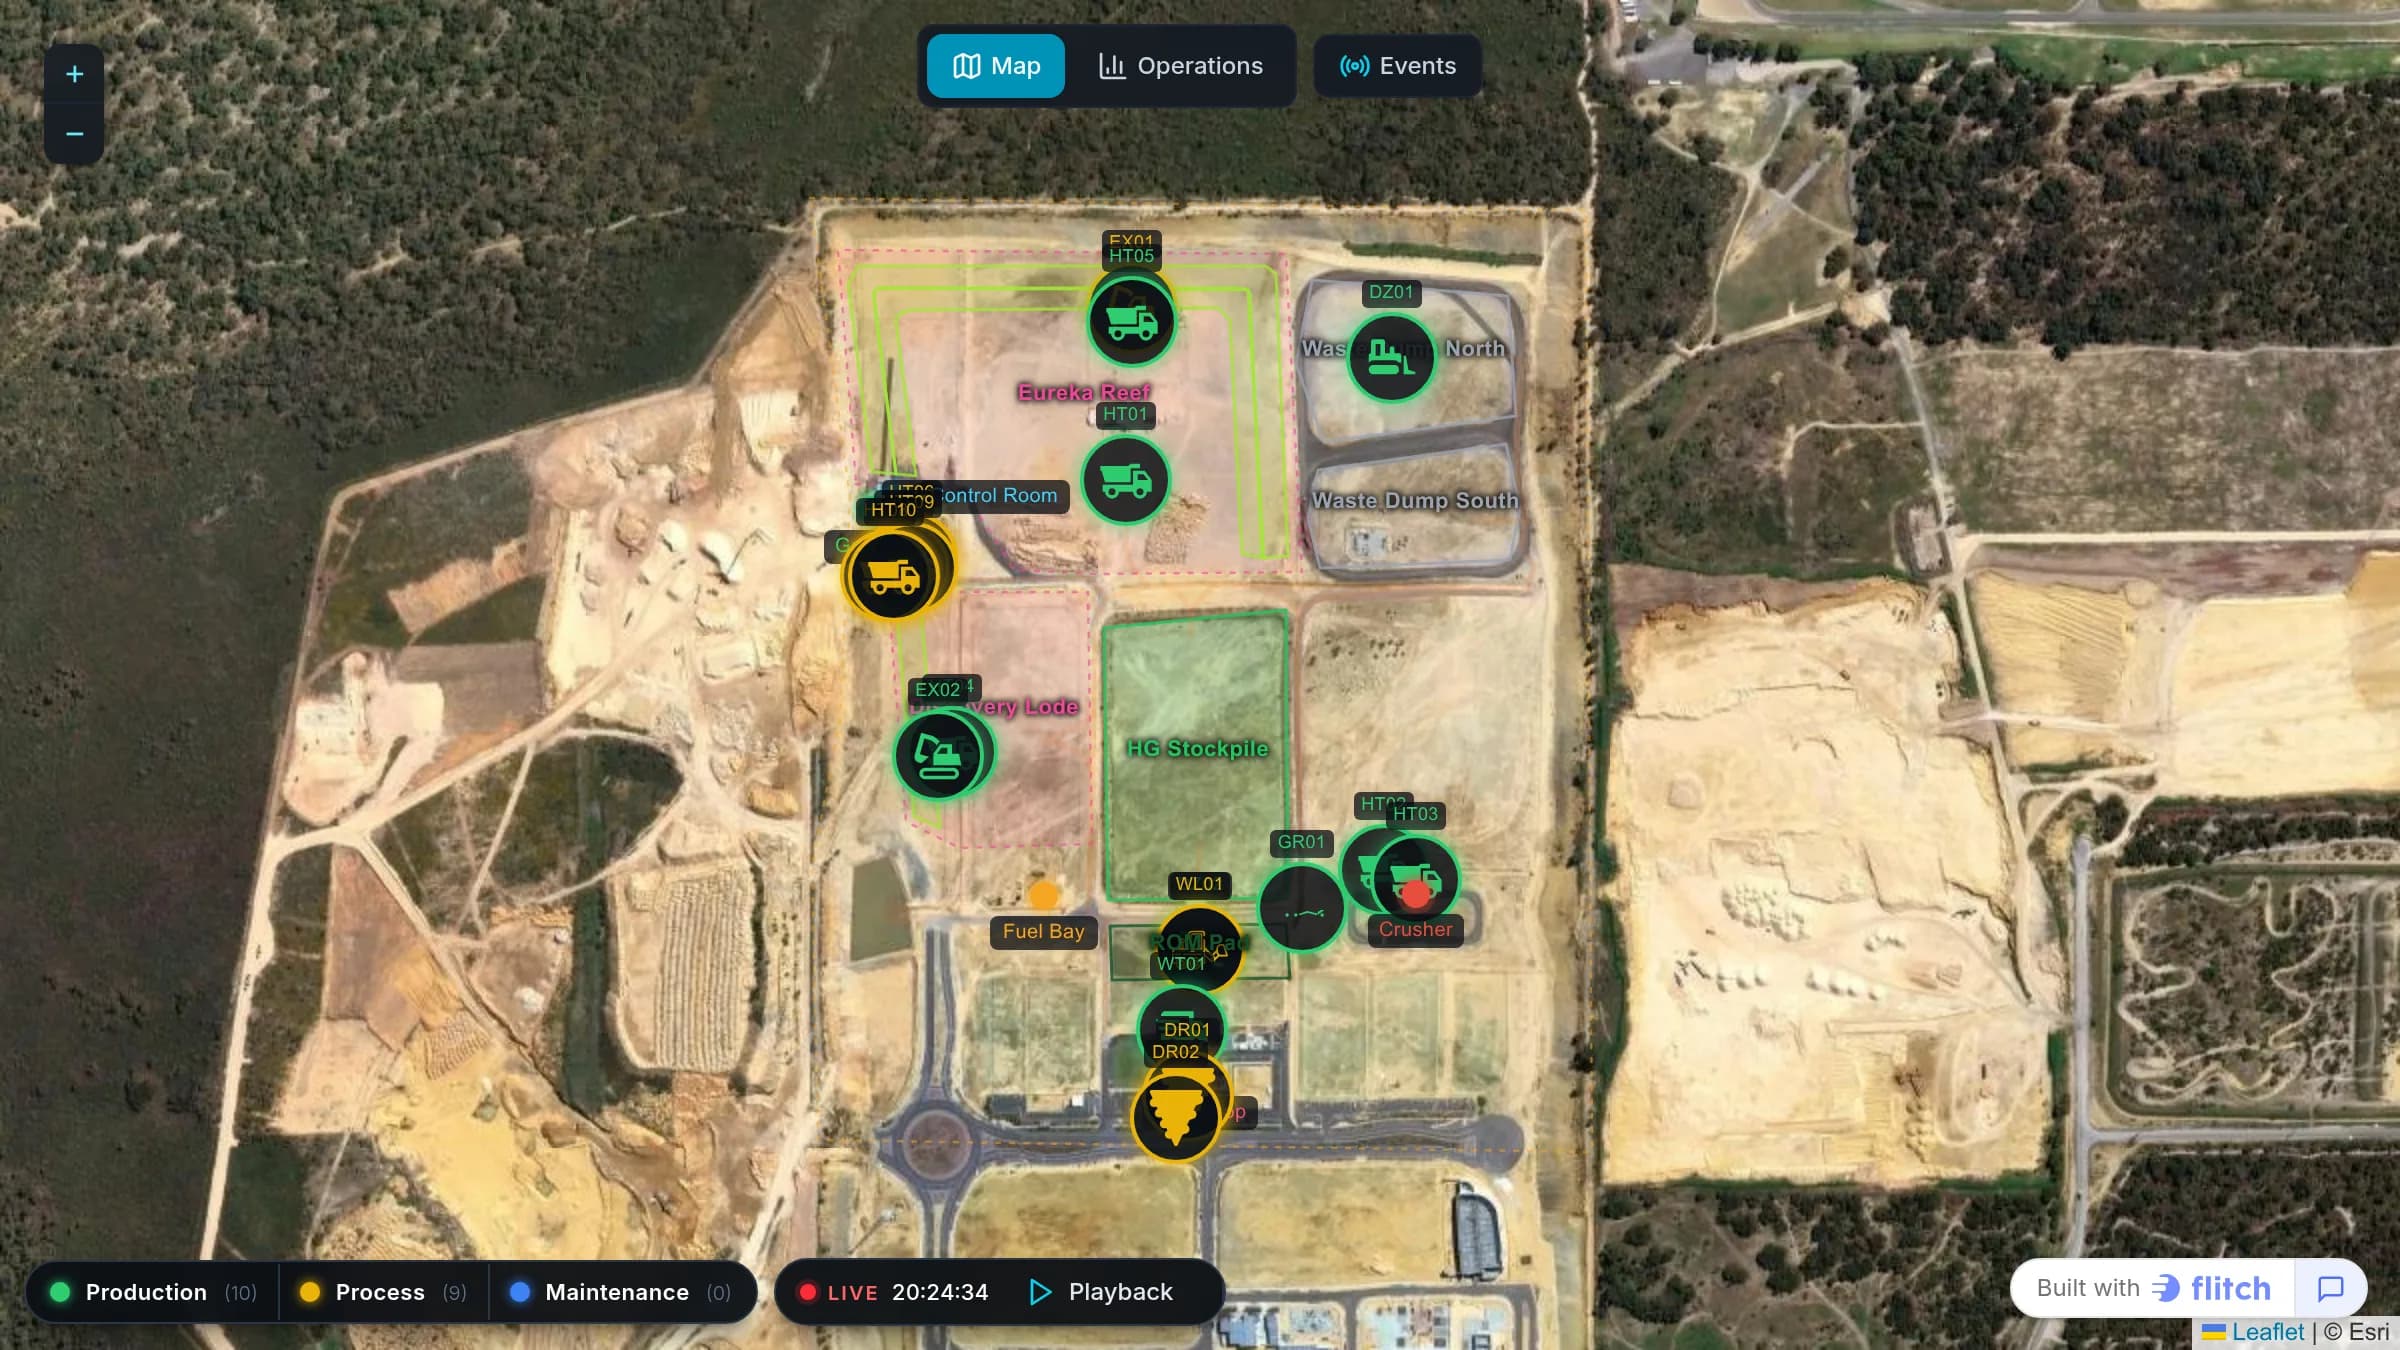
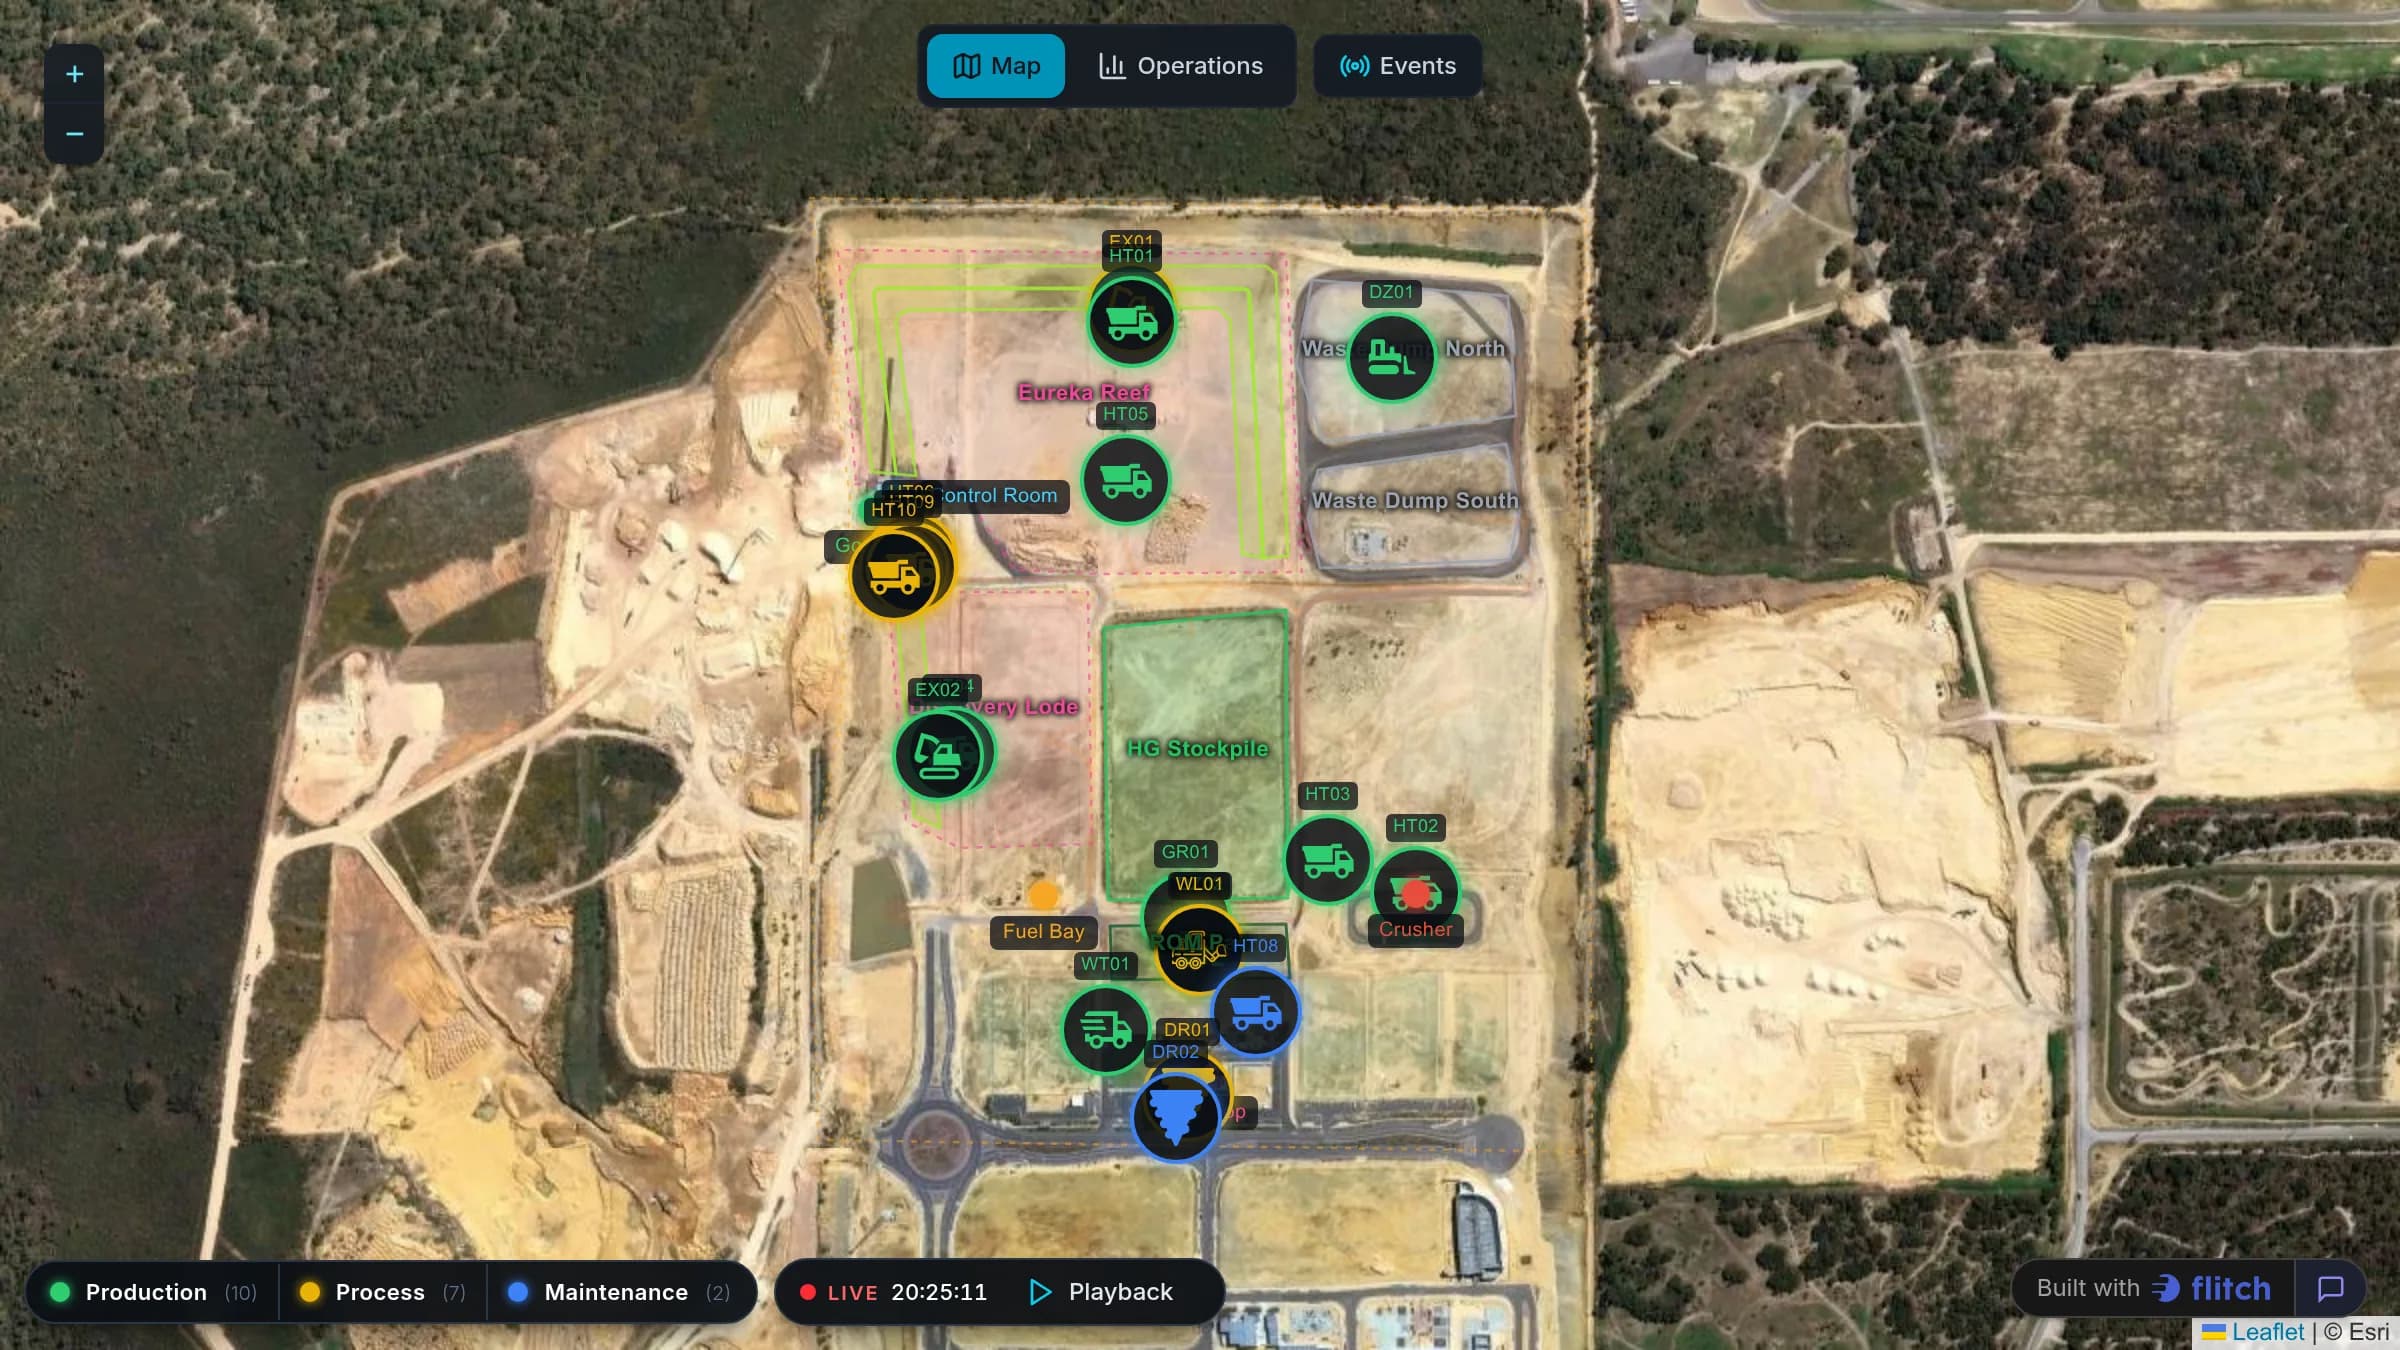
A working dashboard built in Flitch from four CSV exports and a site GeoJSON file. It replays a full 24-hour shift on a satellite map, shades each machine by status, and lets supervisors log dispatch assignments and delays while the shift runs. Copy it into your own space and point it at your own data.
What the dashboard does
- A satellite map of the whole site as the page itself, not a widget in the corner
- Every machine moving minute by minute, shaded by status and iconed by equipment type
- Playback at 1x, 10x or 60x, a scrubbable 24-hour timeline and a Go Live control
- A KPI strip, an event ticker of status changes, and a detail drawer for any unit you click
- A fleet dispatch board of the shift truck to digger assignments
- A delay log of downtime by category and reason
- An operator scorecard: cycles, tonnes, dig rate and availability against target
- Stock movement for the shift: material moved, productive against rehandle, progress to target
What data sits behind it
| Dataset | What it carries |
|---|---|
| fleet-telemetry | One row per machine per minute: position, heading, speed and status. |
| cycles | Load and haul cycles, with tonnes, distance and duration. |
| operators | Who was rostered on which unit, behind the scorecard. |
| facility-totals | Material received at the crusher, the waste dump and the stockpiles. |
| mine-site | A GeoJSON of the pits, benches, haul roads and facilities, drawn under the fleet. |
Tables people fill in
Not everything worth reporting on comes out of a system. These are written by hand, inside the dashboard, as the work happens. Your copy gets the tables and the controls, and starts empty.
- Dispatch Assignments The shift truck to digger assignments, added and edited inside the dashboard.
- Delay Log Downtime entries supervisors record as the shift runs, with category and reason.
How it was built
Nobody laid this out by hand. It came from one prompt, against the datasets above, and was refined from there. This is the prompt, unedited.
Build a "Live Mine" operations console that replays one 24-hour shift at an open-pit mine. A Leaflet map with a satellite basemap is the whole page. Draw the site GeoJSON as static layers underneath (pits, benches, haul roads, facilities), then move each machine over it minute by minute from the telemetry, shaded by status and iconed by equipment type, with a heading arrow and a fading trail. Interpolate between positions so movement is smooth. Playback bar: play/pause, 1x/10x/60x, a scrubbable 24-hour timeline and a Go Live control. Over the map: a KPI strip, an event ticker of status changes, a click-a-unit detail drawer and a legend. Four panels open as dialogs over the map: - Fleet dispatch board, the shift's truck-to-digger assignments - Delay log, downtime by category and reason - Operator scorecard, cycles, tonnes, dig rate, usage and availability against target - Stock movement, material moved this shift, productive against rehandle, and progress to target Dispatch assignments and the delay log are input tables supervisors fill in during the shift, so they need add, edit and delete. Dark control-room theme, no page navigation.
Mining fleet dashboard FAQ
Is this built on real mine data?
No. It runs on a synthetic 24-hour shift at an open-pit site, generated so that the movement, the cycles and the delays all agree with each other. It is here to show the shape of the thing. When you copy it, you replace the datasets with your own.
What do I get when I copy it?
Your own dashboard in your own space, with its own copy of the five datasets and its own two input tables. Nothing you do to your copy touches the original, and nothing that happens to the original reaches your copy.
Can I point it at my own fleet management system?
Yes. The four tables are uploaded files, so the quickest route is to export the same shape from your FMS. Anything Flitch connects to can feed it instead, including a database, a warehouse or a scheduled file drop, and you can ask the assistant to reshape the dashboard around what you actually have.
Do the dispatch and delay entries come with the copy?
No, those two tables start empty. The entries stay with the original. The tables themselves, their columns, and the add, edit and delete controls all come across, so your copy is ready to record its own shift.
Anyone can open it, so can anyone write into the delay log?
No. Reading a published dashboard and writing to a table inside it are separate permissions. The dashboard is public, so the link works for anyone, while an entry has to be attributable to somebody, so adding or changing one requires signing in. An anonymous write is refused whether the dashboard is public or not.
Start from this one
You get your own copy, with its own data, in your own space. Change anything you like.
Use this template